Despite the vast number of guidelines touting capnography, some clinicians may not see its value due to a lack of knowledge and ability to correctly apply and interpret results in a meaningful manner.
Capnography was first proposed for use in the operating room in 1978 and has since become the standard of care for monitoring ventilation.1 Capnography is rapidly growing in use for intubated and nonintubated applications across hospital environments including the ICU, resuscitation, procedural sedation, and postoperative monitoring of patients receiving opioid analgesia.1-2
When used appropriately, capnography has been cited as meaningful in providing key, often life-sustaining, information in dozens of different clinical applications. These range from common indications such as monitoring for apneas, hypoventilation, hyperventilation, and airway integrity during procedural sedation or in postoperative patients; to monitoring ETT placement, quality of chest compression, and return of spontaneous circulation during resuscitation efforts; to screening for diabetic ketoacidosis, pulmonary embolism, bronchospasm, and even sepsis in the emergency setting.1-4
This value has led to capnography being recommended or required for various applications by over 80 clinical societies in over 100 guidelines, standards, and statements in just the past eight years.
Undervalued, Underutilized
Despite the vast number of societal guidelines and clinical articles touting its value, we have met clinicians who state they do not see much value in capnography. What’s the difference between these two groups? Does it work for some and not for others? Of course not. The difference is in their knowledge and ability to correctly apply and interpret the results in a meaningful manner.
With any monitoring parameter, effective application is dependent upon interpreting the parameter values (eg etCO2, RR, waveforms, and trends) within the broader context of the patient’s signs, symptoms, and other clinical data available, and then using their using their expertise to assimilate this information to inform best interventions. Capnography waveforms can be insightful for clinical intervention and require a similar systematic approach, much like ECG interpretation.
Systematic approaches to waveform interpretation for other parameters have been documented and published. The development of clinical decision tools can be used for waveform interpretation and a systematic approach could possibly reduce errors of interpretation or clinical intervention. Such a tool can serve as a bridge to fill gaps in knowledge while the clinician develops a better understanding of the basic principles of interpretation. Like all physiologic monitors, each has limitations and requires a standardized method for interpretation and translating this information into clinical practice.5

Figure 1. A systematic approach for capnography waveforms of intubated patients [6-15]. Click image for a larger version. Note: This resource is intended for educational purposes only. Please see editor’s note below.
Methods for Interpretation
A systematic approach for capnography waveform analysis is presented in Figure 1 (intubated patients) and Figure 2 (non-intubated patients). Changes in the waveform provide the earliest indication of problems when ventilation becomes abnormal. For example, a patient experiencing an apnea will have a flatline capnography waveform immediately after the apnea begins, and yet oximetry may not indicate a desaturation for several minutes.
![Figure 1. A systematic approach for capnography waveforms of non-intubated patients [6-15]. Click image for a larger version. Note: This resource is intended for educational purposes only. Please see editor's note below.](https://respiratory-therapy.com/wp-content/uploads/2019/02/PatientMonitoring_Figure2.jpg)
Figure 2. A systematic approach for capnography waveforms of nonintubated patients [6-15]. Click image for a larger version. Note: This resource is intended for educational purposes only. Please see editor’s note below.
When looking at the end-tidal carbon dioxide (etCO2) reading, start by noting the patient’s baseline value, does it fall in the 35-45 mmHg normal range? Changes in this reading, with a clear alveolar plateau, can indicate changes in ventilation, perfusion, or metabolic status as indicated in the examples seen in the flow chart. Also consider the respiratory rate derived from the etCO2 readings, and changes caused by tachypnea or bradypnea to the end-tidal reading.
Finally, trend graphs can be helpful for looking at changes over time. A good example is a patient with obstructive sleep apnea, where etCO2 values will show repetitive drops and increases subsequent to apneic/hypopneic events.
Waveform Example
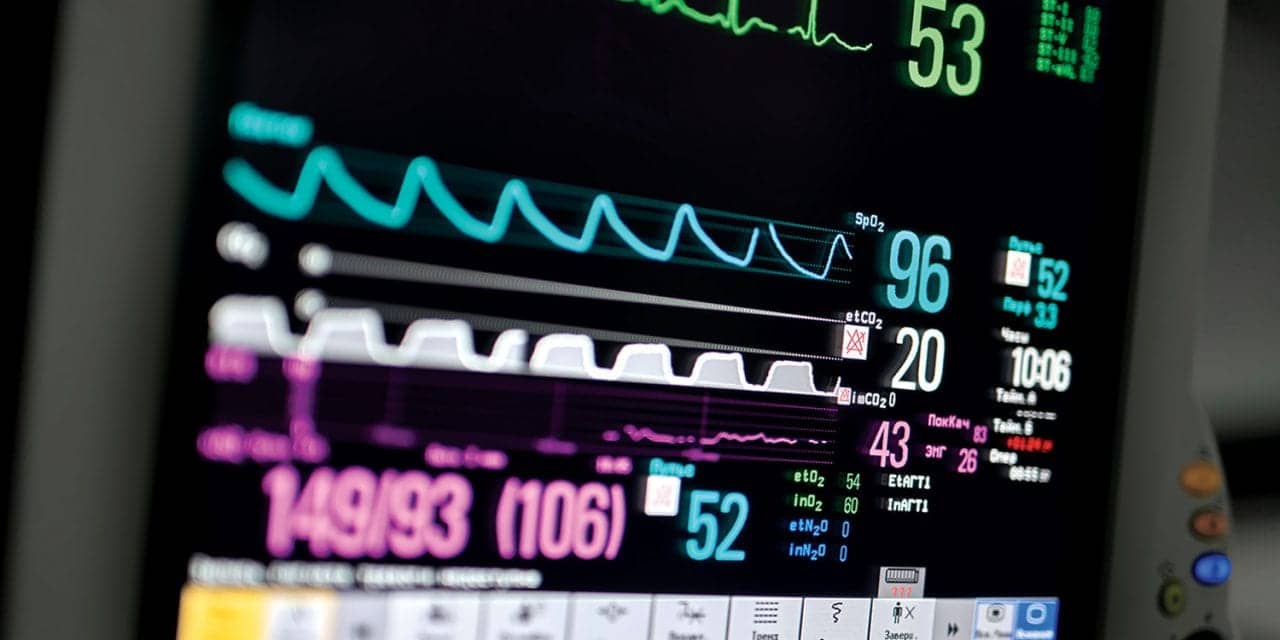
In the example (see Figure 3), you will notice the capnograph reading and the etCO2 of five. First, look at the shape of the waveform. It is not square in shape, so the clinician should evaluate equipment and proper placement of the sampling line (eg cannula), check the airway for integrity (eg, reposition and jaw thrust), considering possible airway obstruction or hypopneic breathing (suspect shallow breathing when waveforms are non-plateauing).

Figure 3. Sample capnography waveform and reading. The pale blue waveform represents the patient’s etCO2, which indicates a reading of 5.
This patient had received a benzodiazepine and opioid narcotic for procedural sedation and as the patient did not exhibit symptoms of airway obstruction, the patient was encouraged to take deep breaths and sedation medication was reduced which brought the waveform back to a normal appearance and the etCO2 reading back to a normal range. Note that the SpO2 reading is normal (97%) as oxygen desaturations generally lag minutes after the onset of changes to ventilation, especially when supplemental oxygen is in use. Although the alarm is alerting the clinician to the low etCO2, the first intervention is to assess airway and breathing adequacy and intervene appropriately. A number of additional example waveforms can be viewed by downloading an interactive tool here.
Capnography and the associated waveforms can provide the clinician with useful information to inform intervention for a variety of clinical scenarios for both intubated and non-intubated patients. Data from the capnograph should always be assessed within the context of the patient’s overall condition including signs, symptoms, vital signs, and other monitoring parameters. A systematic approach to the interpretation of the waveform could lead to earlier intervention with appropriate clinical response and treatment. RT
Editor’s note: The information in Figure 1 and Figure 2 was provided by Medtronic for educational purposes only. It is not intended to provide comprehensive or patient specific clinical practice recommendations for capnography monitoring. The clinical choices outlined in this text may or may not be consistent with your own patient requirements, your clinical practice approaches, or guidelines for practice that are endorsed by your institution or practice group.
Gina Farquharson, MS, MBA, RRT-NPS, CPPS is senior technical consultant on Capnography, Medtronic. Gregory K Spratt, BS, RRT, CPFT is the Director of Market Development, Medtronic. For more information, contact [email protected].
References
1. Whitaker DK, Benson JP. Capnography standards for outside the operating room. Curr Opin Anesthesiol 2016, 29:485–492.
2. Kodali BS. Capnography Outside the Operating Rooms. Anesthesiology 2013; 118(1):192-201.
3. Krauss B, Silvestri S, Falk JL. Carbon dioxide monitoring (Capnography) www.uptodate.com 2014.
4. Brast JS, Bland E, Jones-Hooker C, Long M, Green K. Capnography for the radiology and imaging nurse: A primer. Journal of Radiology Nursing. Published September 2016.
5. Krauss B, Hess DR. Capnography for procedural sedation and analgesia in the emergency department. Ann Emerg Med. 2007;50(2):172-181. Epub Jan. 12, 2007.
6. Chameides L, Samson RA, Schexnayder SM, Hazinski MF, eds. Pediatric Advanced Life Support Provider Manual: Professional Edition. Dallas, TX: American Heart Association; 2011.
7. Badgwell JM, Kleinman SE, Heavner JE. Respiratory frequency and artifact affect the capnographic baseline in infants. Anesth Analg. 1993;77:708-711.
8. Gravenstein JS, Jaffe MB, Gravenstein N, Paulus DA, eds. Capnography. 2nd ed. New York, NY: Cambridge University Press; 2011.
9. Huether SE, McCance KL. Understanding Pathophysiology. 2nd ed. St. Louis, MO: Mosby; 2000.
10. Beitz A, Riphaus A, Meining A, Kronshage T, Geist C, Wagenpfeil S, et al. Capnographic monitoring reduces the incidence of arterial oxygen desaturation and hypoxemia during propofol sedation for colonoscopy: a randomized, controlled study. Am J Gastroenterol. 2012;107(8):1205-1212.
11. Bhananker SM, Posner KL, Cheney FW, Caplan RA, Lee LA, Domino KB. Injury and liability associated with monitored anesthesia care: a closed claims analysis. Anesthesiology. 2006;104(2):228-234.
12. MedicineNet.com. Definition of hyperventilation. http://www.medicinenet.com/script/main/art.asp?articlekey=3853. Accessed May 8, 2018.
13. Curry JP, Jungquist CR. A critical assessment of monitoring practices, patient deterioration, and alarm fatigue on inpatient wards: a review. Patient Saf Surg. 2014;8:29.
14. Anderson CT, Breen P. Carbon dioxide kinetics and capnography during critical care. Crit Care. 2000;4(4):207-215.
15. Ward KR, Yealy DM. End-tidal carbon dioxide monitoring in emergency medicine, part 2: clinical applications. Acad Emerg Med. 1998;5(6):637-646.